Contact Us to learn more about our services.
30
December
Farmer sentiment pulls back post-election: regulation, trade, and taxes rated as top concerns
James Mintert and Michael Langemeier, Purdue Center for Commercial Agriculture
A breakdown on the Purdue/CME Group Ag Economy Barometer November results can be viewed at https://purdue.ag/barometervideo. Find the audio podcast discussion for insight on this month’s sentiment at https://purdue.ag/agcast.
Download report (pdf)
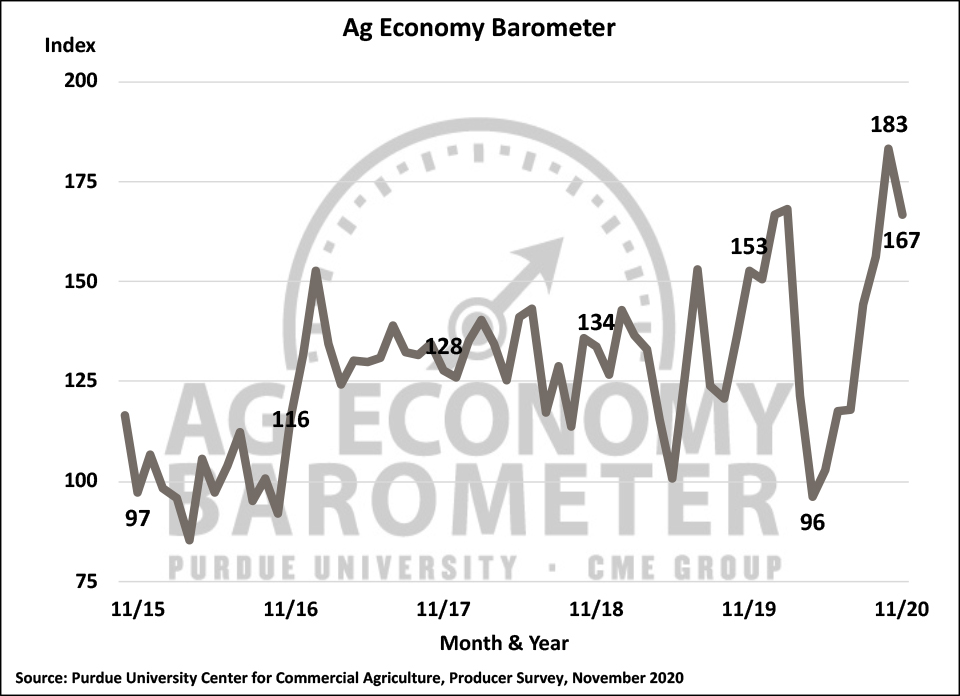
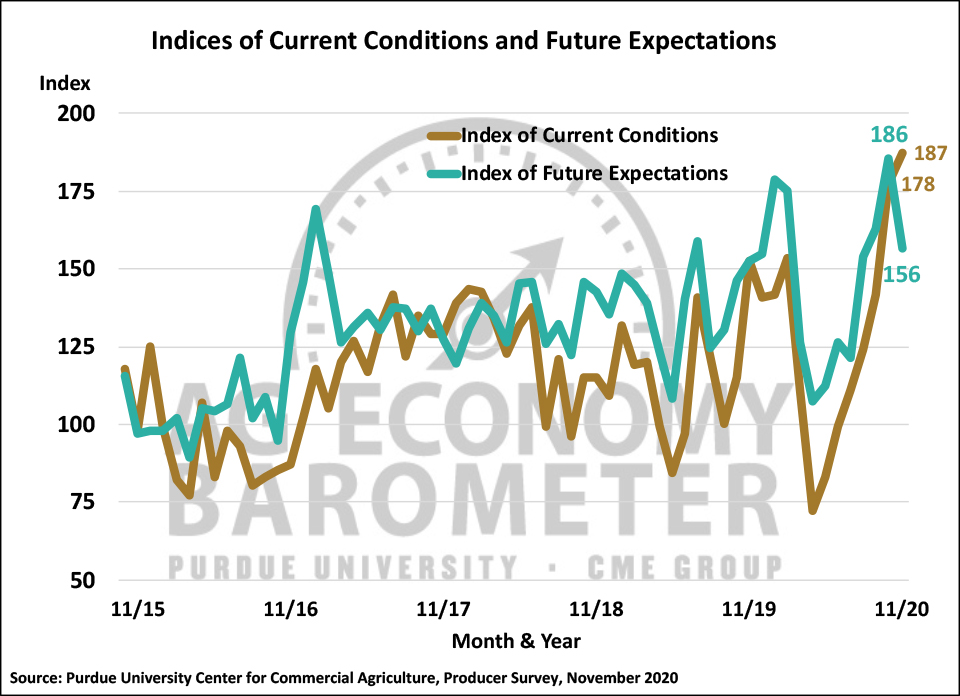
U.S. farmers sentiment weakened following the November 2020 elections, as the Purdue University-CME Group Ag Economy Barometer fell 16 points from a month earlier to a reading of 167. Although this month’s reading was nearly equal to the pre-pandemic high set back in February, it was 9 percent lower than the sentiment reading taken just two weeks prior to the 2020 elections. The decline in the Ag Economy Barometer was the result of weakened expectations for the future on the part of agricultural producers, as the Index of Future Expectations declined to a reading of 156 in November, 30 points below the October reading. On the other hand, farmers perception of current conditions on their farms actually improved. The Index of Current Conditions, buoyed by the ongoing rally in agricultural commodity prices, rose by 9 points from October to November setting a new record high for the index of 187. The Ag Economy Barometer is calculated each month from 400 U.S. agricultural producers’ responses to a telephone survey. This month’s survey was conducted from November 9-13, 2020.
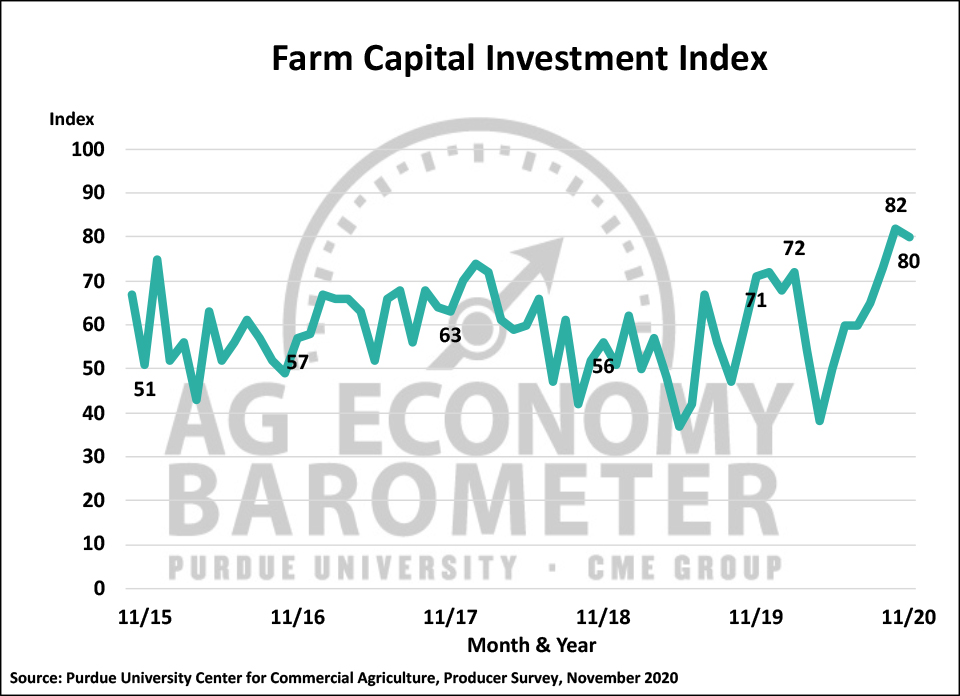
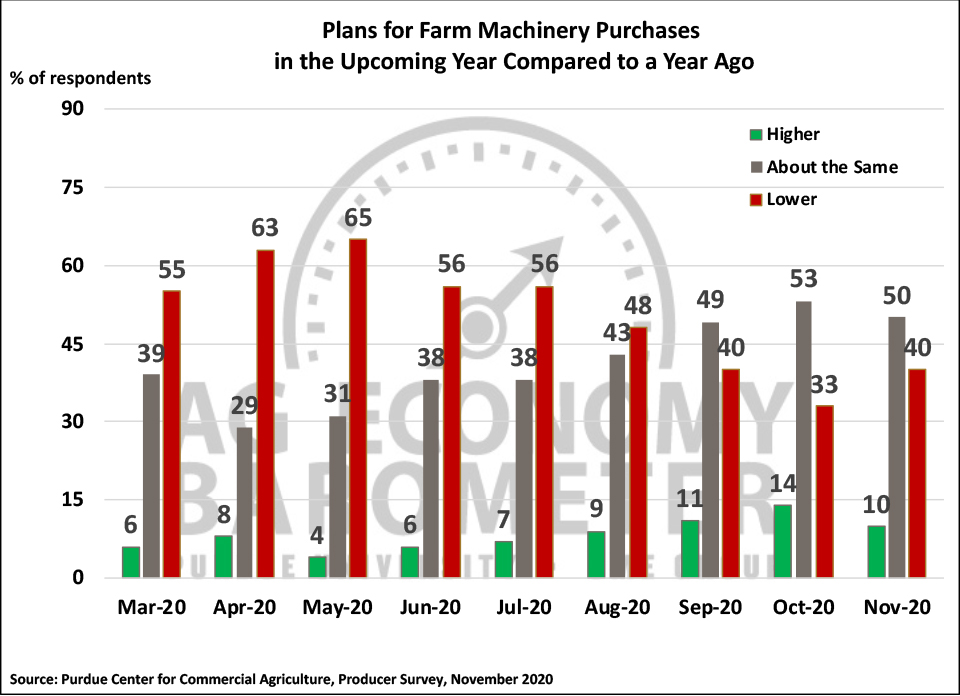
Although farmers’ expectations for the future weakened, they remained relatively optimistic about making large investments in their operations, as the Farm Capital Investment Index changed little in November with a reading of 80, just 2 points below the index’s record high set back in October. However, when asked more specifically about their plans with respect to farm machinery purchases, survey respondents pulled back somewhat in November compared to October. In this month’s survey, 10 percent of farmers said they planned to increase their farm machinery purchases compared to a year earlier, down from 14 percent who planned to increase purchases back in October. At the same time, the percentage of farmers planning to keep their machinery purchases even with a year ago, fell from 53 to 50 percent on the November survey, while the percentage of respondents planning to reduce their purchases rose from 33 to 40 percent.
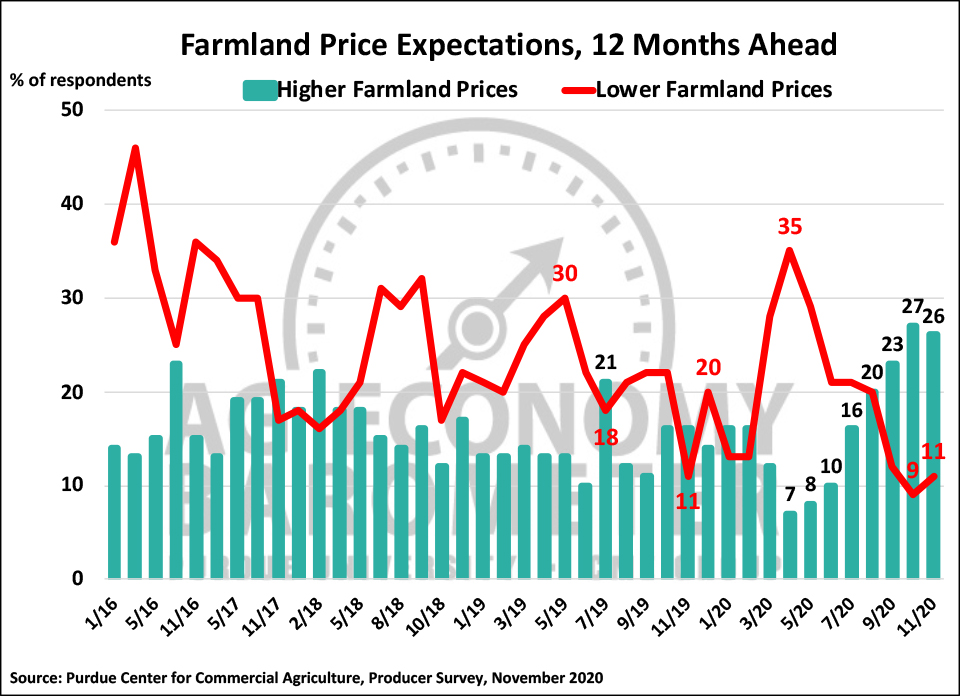
Producers’ optimistic view of current conditions on their farms provided support to their short-run perceptions about farmland values. When asked to look ahead 12-months, survey respondents’ expectations for farmland values in November were virtually unchanged compared to a month earlier. However, consistent with the decline in future expectations among survey respondents, there was a softening in producers’ longer-term views on farmland values. In particular, the percentage of producers expecting to see farmland values rise over the next five years declined from 59 percent in October to 54 percent in November. Still, that remains a much more optimistic view on farmland values than this past spring when the percentage of producers expecting to see farmland values rise over the next five years ranged from 41 to 44 percent.
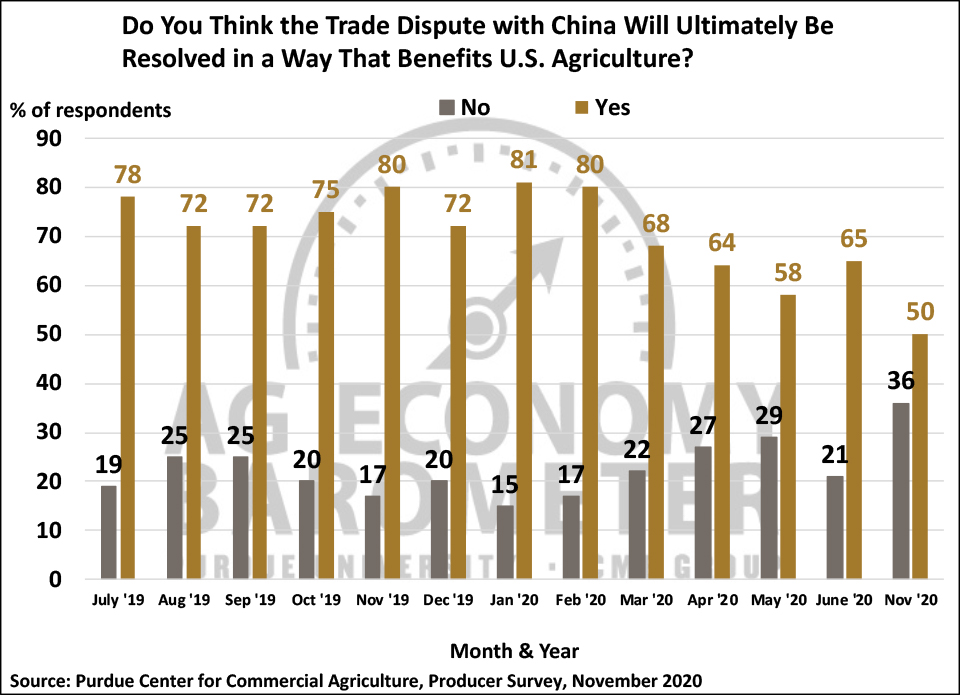
Farmers’ attitudes regarding the trade dispute with China have changed over the course of 2020. Back in January and February of this year, 80 percent of survey respondents said they expected to see the trade dispute with China be resolved in a way that benefits U.S. agriculture. Optimism about the trade dispute started to fade last spring with approximately two-thirds of respondents during the spring quarter still expecting a favorable outcome. On the November survey, the percentage of farmers expecting a favorable outcome for U.S. agriculture declined to 50 percent, the lowest percentage recorded since we first posed this question in the summer of 2019. In a related question, only 44 percent of respondents to the November survey said they think it’s likely that China will fulfill the Phase One Trade Agreement requirements, down from 59 percent a month earlier.
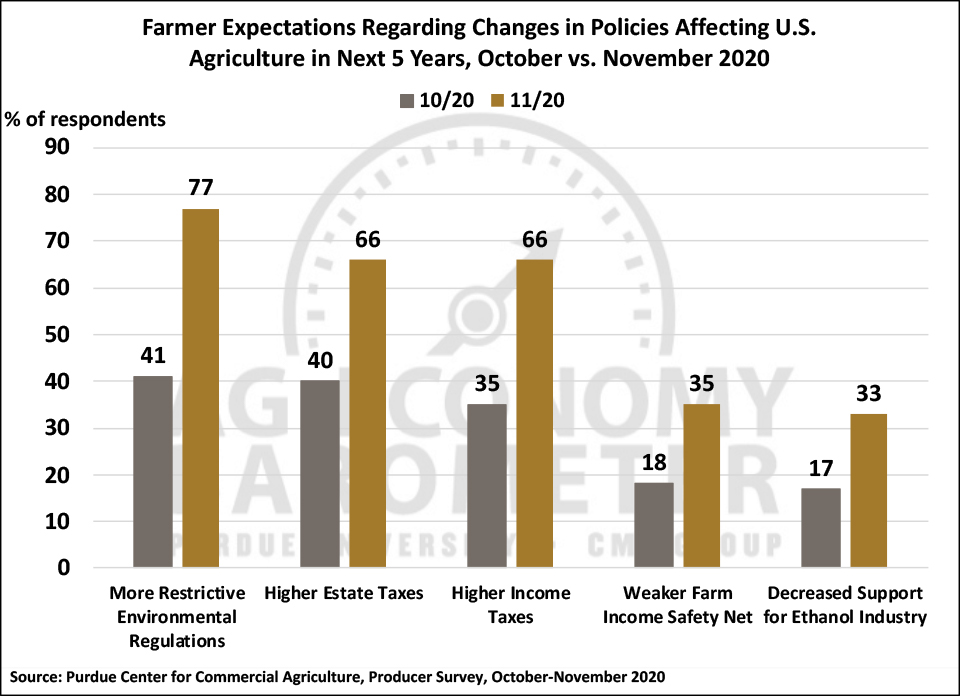
To learn more about what might be motivating shifts in producers’ sentiment pre- and post-November election, several new questions regarding whether they expect to see changes to regulations, taxes, and other aspects of the agricultural economy (see below) in the next 5 years, were included on both the October and November surveys. Month-to-month shifts in responses to these questions provide some insight into the decline observed in the Index of Future Expectations that took place this month. Comparing results from October to November, far more producers in November said they expect to see 1) environmental regulations impacting agriculture to tighten over the next five years; 2) higher income tax rates for farms and ranches; 3) higher estate tax rates for farms and ranches; 4) less government support for the U.S. ethanol industry and 5) a weaker farm income safety net provided by U.S. government program policies. On the November survey, 77 percent of respondents said they expect more restrictive environmental regulations five years from now vs. 41 percent who felt that way in October. When asked about income tax rates, 66 percent of respondents in November said they expect higher rates for farms and ranches five years from now compared to just 35 percent who felt that way in October. Similarly, 66 percent of respondents in November also indicated that they expect higher estate tax rates for farms and ranches compared to 40 percent who said they expected higher estate taxes for farms and ranches back in October. The percentage of producers who said they expect government support for the U.S. ethanol industry to decline nearly doubled from October to November with 33 percent of respondents in November expecting government support to decline over the next five years compared to just 17 percent in October. This was similar to the shift in attitudes regarding the farm income safety net as 35 percent of respondents in November said they expect to see a weaker farm safety net five years from now compared to 18 percent who felt that way in October.
Wrapping Up
Farmer sentiment weakened in November as the Ag Economy Barometer declined to a reading of 167. The decline was entirely attributable to weaker expectations for the future as the Index of Current Conditions actually rose to a new record high while the Index of Future Expectations declined. Agricultural producers remained optimistic about making large investments in their farming operations, although fewer producers in November than October said they expect to increase their farm machinery purchases compared to a year earlier. Farmer’s attitude regarding the short-run direction of farmland values was virtually unchanged from October, while their longer-run view of future farmland values softened somewhat compared to a month earlier. Shifts in responses to questions posed on both the October and November surveys, suggest that weakness in the Index of Future Expectations following the November election was at least partially explained by concerns about: 1) future environmental regulations impacting agriculture; 2) higher income and estate tax rates for farms and ranches; 3) potential for reduced government support for the U.S. ethanol industry and 5) a weaker farm income safety net possibly being provided by U.S. government program policies.